Select, match and pipe output into another command with jq, grep, and xargs

select-match-and-pipe-output-with-jq-grep-xargs

This is a quick reference post if you’re looking to pipe output into another command on Linux using xargs.

The pipeline is immensley powerful and you can leverage it to act on different stages of your full command to do specific selecting, matching, and manipulation.

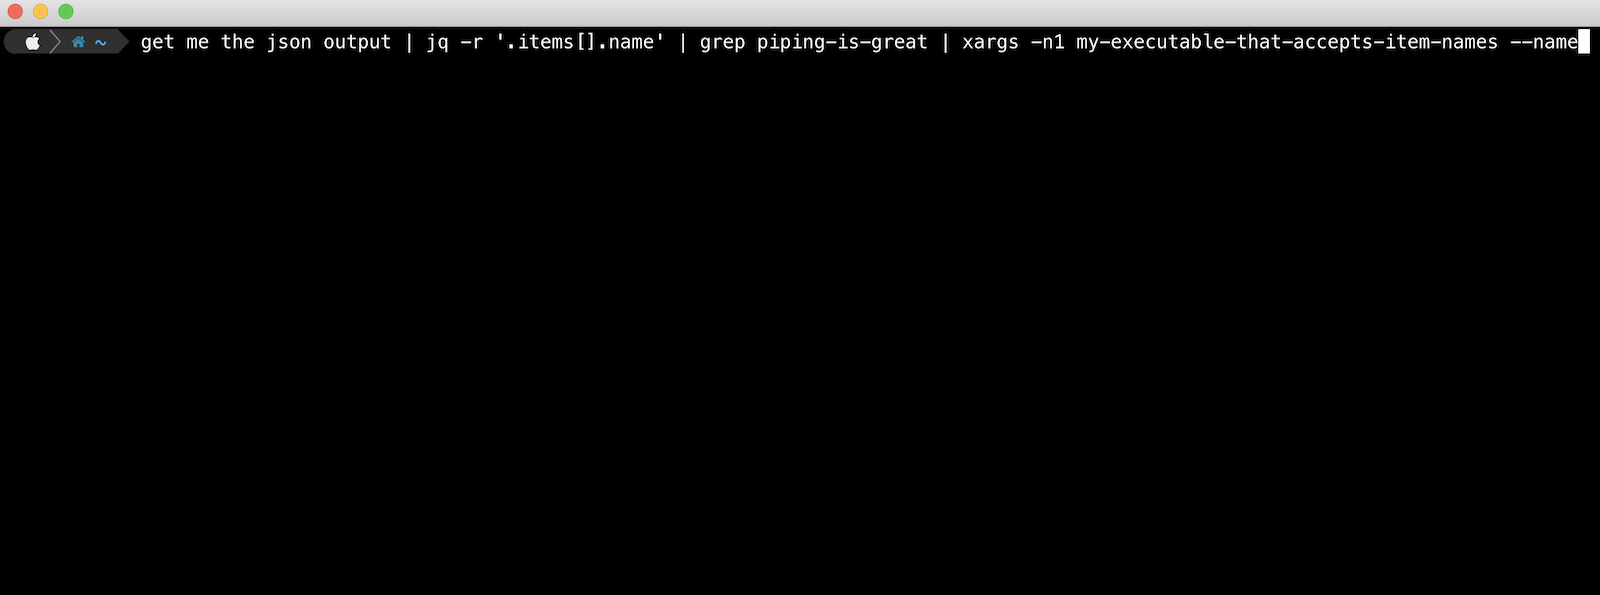
Say you are running an executable that outputs a bunch of JSON and you want to select certain a certain subset of this data, pattern match it, and then send that matched data into another command.

This is the perfect use case for a mixture of the jq, grep and xargs commands in the pipeline.

Practical example with xargs

Here is a practical example where you might want to list all your AWS CodePipeline pipelines, match only on certain ones, and then execute (Release Changes) on each of them.

aws codepipeline list-pipelines | jq -r '.pipelines[].name' | grep project-xyz | xargs -n1 aws codepipeline start-pipeline-execution --name

The piped command above does the following:

  • Lists all AWS CodePipelines with the command aws codepipeline list-pipelines
  • Uses jq to ‘raw’ select the name from each pipeline object in the pipelines[] array that the above command outputs
  • Sends each pipeline name into grep to match only those containing the string “project-xyz”
  • Pipes the resulting pipeline names using xargs into the command aws codepipeline start-pipeline-execution --name. The -n1 argument tells xargs to use at most max-args of 1 per command line.

How to restart a slave FortiGate firewall in an HA cluster

Here’s a quick how-to on restarting a specific member of a High Availability FortiGate hardware firewall cluster. I have only tested this on a cluster of FG60 units, but am quite sure the steps would be similar for a cluster of FG100s, FG310s etc…

get-ha-status

First of all you may or may not want to set up some monitoring going to your various WAN connections on the HA cluster. Restarting the slave unit should not have any effect on these connections in theory as your master unit is the one handling all the work. The slave is merely there to take over should things go pear shaped on the master unit. When the slave restarts you can watch your ping statistics or other connections just to ensure everything stays up whilst it reboots.

1. Start by logging in to the web interface of your firewall cluster. https://ipaddress

2. Specify a custom port number if you have the management GUI on a custom port for example https://ipaddress:555

3. Login and look for “HA status” under the status area – this should be the default page that loads. It should show as “Active-passive” if this is the mode your HA cluster is in. Click the [Configure] link next to this.

4. This will give you an overview of your HA cluster – you can view which unit is the Master and which is the slave. This step is optional and just gives you a nice overview of how things are looking at the moment. Click “View HA statistics” near the top right if you would like to view each unit’s CPU/Memory usage and other statistics.

5. Return to the “Status” home page of your firewall GUI. Click in the “CLI Console” black window area to get to your console. (Optionally, you could also just SSH in if you have this enabled).

6. Type the following command to bring up your HA cluster details: get system ha status

7. This will show which firewall is master and slave in the cluster e.g.

Master:129 FG60-1 FWF60Bxxxxxxxx65 1
Slave :125 FG60-2 FWF60Bxxxxxxxx06 0

Look for the number right at the end and note this down. In the above example the Slave unit has the number “0” . Note this down.

8. Next enter the following command: execute ha manage x

Where “x” is the number noted down in step number 7.

This will change your management console to this particular firewall unit. i.e. the slave unit in our case. You should notice your command line change to reflect the name of the newly selected HA member.

9. Enter the following command to reboot the slave: execute reboot

10. Press “Y” to confirm and reboot the slave.

Monitor your ping / connection statistics to ensure everything looks fine. Give it a minute or so to boot up again, then return to your HA statistics page to ensure everything looks good.

That is all there is to it.