Getting Started
If you managed to follow and complete the previous blog post, then you managed to get a Kubernetes cluster up and running in your own private AWS VPC using kops and Terraform to assist you.
In this blog post, you’ll cover following items:
- Setup upstream DNS for your cluster
- Get a Kubernetes Dashboard service and deployment running
- Deploy a basic metrics dashboard for Kubernetes using heapster, InfluxDB and Grafana
Upstream DNS
In order for services running in your Kubernetes cluster to be able to resolve services outside of your cluster, you’ll now configure upstream DNS.
Containers that are started in the cluster will have their local resolv.conf files automatically setup with what you define in your upstream DNS config map.
Create a ConfigMap with details about your own DNS server to use as upstream. You can also set some external ones like Google DNS for example (see example below):
apiVersion: v1
kind: ConfigMap
metadata:
  name: kube-dns
  namespace: kube-system
data:
  stubDomains: |
    {"yourinternaldomain.local": ["10.254.1.1"]}
  upstreamNameservers: |
    ["10.254.1.1", "8.8.8.8", "8.8.4.4"]
Save your ConfigMap as kube-dns.yaml and apply it to enable it.
kubectl apply -f kube-dns.yaml
You should now see it listed in Config Maps under the kube-system namespace.
Kubernetes Dashboard
Deploying the Kubernetes dashboard is as simple as running one kubectl command.
kubectl apply -f https://raw.githubusercontent.com/kubernetes/dashboard/master/src/deploy/recommended/kubernetes-dashboard.yaml
You can then start a dashboard proxy using kubectl to access it right away:
kubectl proxy
Head on over to the following URL to access the dashboard via the proxy you ran:
http://localhost:8001/api/v1/namespaces/kube-system/services/https:kubernetes-dashboard:/proxy/
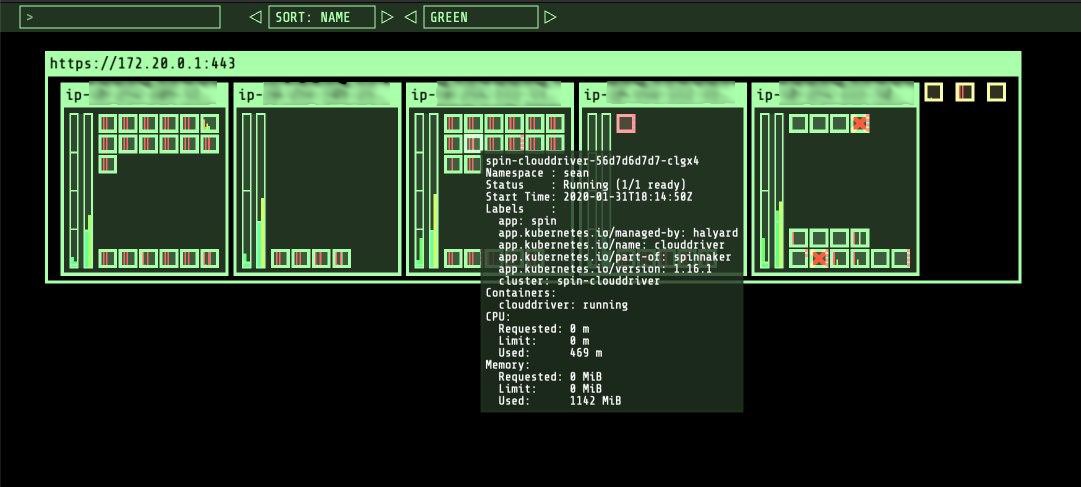
You can also access the Dashboard via the API server internal elastic load balancer that was set up in part 1 of this blog post series. E.g.
https://your-internal-elb-hostname/api/v1/namespaces/kube-system/services/https:kubernetes-dashboard:/proxy/#!/overview?namespace=default
Heapster, InfluxDB and Grafana (now deprecated)
Note: Heapster is now deprecated and there are alternative options you could instead look at, such as what the official Kubernetes git repo refers you to (metrics-server). Nevertheless, here are the instructions you can follow should you wish to enable Heapster and get a nice Grafana dashboard that showcases your cluster, nodes and pods metrics…
Clone the official Heapster git repo down to your local machine:
git clone https://github.com/kubernetes/heapster.git
Change directory to the heapster directory and run:
kubectl create -f deploy/kube-config/influxdb/
kubectl create -f deploy/kube-config/rbac/heapster-rbac.yaml
These commands will essentially launch deployments and services for grafana, heapster, and influxdb.
The Grafana service should attempt to get a LoadBalancer from AWS via your Kubernetes cluster, but if this doesn’t happen, edit the monitoring-grafana service YAML configuration and change the type to LoadBalancer. E.g.
"type": "LoadBalancer",
Save the monitoring-grafana service definition and your cluster should automatically provision a public facing ELB and set it up to point to the Grafana pod.
Note: if you want it available on an internal load balancer instead, you’ll need to create your grafana service using the aws-load-balancer-internal annotation instead.
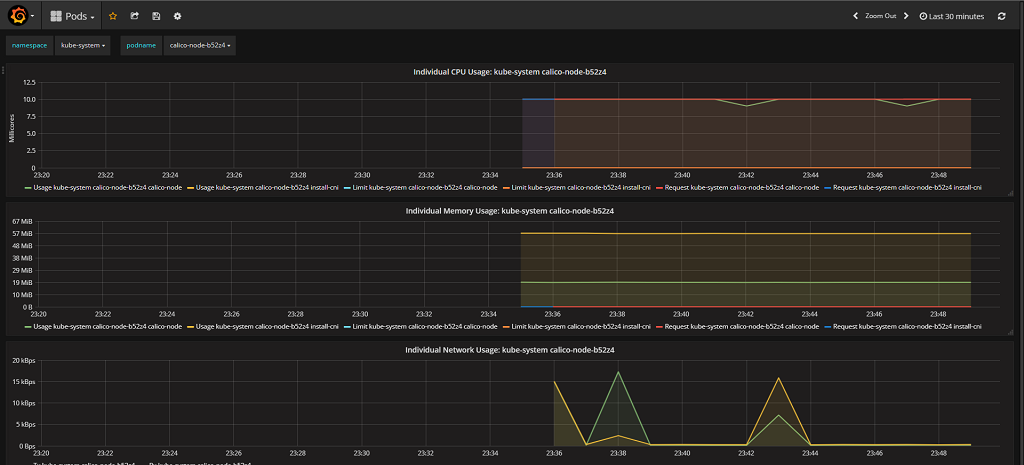
Now that you have Heapster running, you can also get some metrics displayed directly in your Kubernetes dashboard too.
You may need to restart the dashboard pods to access the new performance stats in the dashboard though. If this doesn’t work, delete the dashboard deployment, service, pods, role, and then re-deploy the dashboard using the same process you followed earlier.
Once its up and running, use the DNS for the new ELB to access grafana’s dashboard, login with admin/admin and change the default admin password to something secure and save. You can now access cluster stats/performance stats in kubernetes, as well as in Grafana.
Closing off
This concludes part two of this series. To sum up, you managed to configure upstream DNS, deploy the Kubernetes dashboard and set up Heapster to allow you to see metrics in the dashboard, as well as deploying InfluxDB for storing the metric data with Grafana as a front end service for viewing dashboards.