Running an S3 API compatible object storage server (Minio) on the Raspberry Pi

I’ve recently become interested in hosting my own local S3 API compatible object storage server at home.

So tonight I set about setting up Minio.

Image result for minio

Minio is an object storage server that is S3 API compatible. This means I’ll be able to use my working knowledge of the Amazon S3 API and tools, but to interact with my own, locally hosted storage service running on a Raspberry Pi.

I had heard about Zenko before (an S3 API compatible object storage server) but was searching around for something really lightweight that I could easily run on ARM architecture – i.e. my Raspberry Pi model 3 I have sitting on my desk right now. In doing so, Minio was the first that I found that could easily be compiled to run on the Raspberry Pi.

The goal right now is to have a local object storage service that is compatible with S3 APIs that I can use for home use. This has a bunch of cool use cases, and the ones I am specifically interested in right now are:

  • Being able to write scripts that interact with S3, but test them locally with Minio before even having to think about deploying them to the cloud. A local object storage API is going to be free and fast. Plus it’s great knowing that you’re fully in control of your own data.
  • Setting up a publically exposable object storage service that I can target with serverless functions that I plan to be running on demand in the cloud to do processing and then output artifacts to my home object storage service.

The second use case above is what I intend on doing to send ffmpeg processed video to. Basically I want to be able to process video from online services using something like AWS Lambda (probably using ffmpeg bundled in with the function) and output the resulting files to my home storage system.

The object storage service will receive these output files from Lambda and I’ll have a cronjob or rsync setup to then sync the objects placed into my storage bucket(s) to my home Plex media share.

This means I’ll be able to remotely queue up stuff to watch via a simple interface I’ll expose (or a message queue of some sort) to be processed by Lambda, and by the time I’m home everything will be ready to watch in Plex.

Normally I would be more interesting in running the Docker image for Minio, but at home I want something that is really cheap to run, and so compiling Minio for Raspberry Pi makes total sense to me here, as this device is super cheap to level powered on 24/7 as opposed to running something beefier that would instead run as a Docker host or lightweight Kubernetes home cluster.

Here’s the quick start up guide to get it running on Raspberry Pi

You’ll basically download Go, extract it, set it up on your path, then use it to compile Minio’s source code into an ARM compatible binary that you can run on your pi.

wget https://dl.google.com/go/go1.10.3.linux-armv6l.tar.gz
sudo tar -C /usr/local -xzf go1.10.3.linux-armv6l.tar.gz
export PATH=$PATH:/usr/local/go/bin # put into ~/.profile
source .profile
go get -u github.com/minio/minio
mkdir ~/minio-data
cd go/bin
./minio server ~/minio-data/

And you’re up and running! It’s that simple to get going quickly.

Running interactively you’ll get a default access and secret key in the terminal, so head on over to the Web UI / interface to check things out: http://your-raspberry-pi-ip-or-hostname:9000/minio/

Enter your credentials to login.

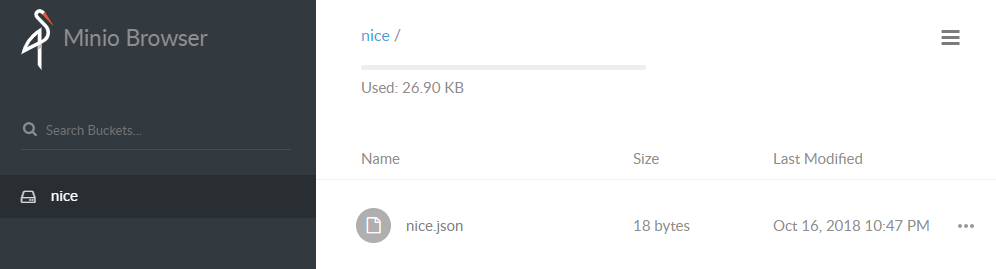
Of course at this stage you can also start using your S3 API compatible command line tools to start working with your new object storage server too.

Nice!

Generating Graphical Charts with VMware PowerCLI & PowerShell

Charts are awesome – they can help make sense of endless reams of text and data and they generally look pretty. So my question to myself was: “How do I get useful data I generate using PowerCLI into a nice, neat little chart?” I had a quick google and found a couple of different solutions. The one that stood out as being the easiest to start off with for me was to use the “Microsoft Chart Controls for Microsoft .NET Framework 3.5

I read a few blog posts around detailing how to create these custom .NET charts in PowerShell, but this tends to be quite a tedious process – akin to creating a Windows Forms GUI in PowerShell manually – basically a complete pain. The blog posts I read definitely helped me understand how to create charts and soon I was able to generate some pretty cool charts based off data from PowerCLI (or PowerShell) data. I wanted to ultimately automate the creation of Charts for my PowerCLI and PowerShell scripts, so I decided to create myself a Function that could be used anywhere to generate a Bar or Pie Chart on the fly.

httpv://youtube.com/watch?v=EvQ2znWr0lk

Enter Create-Chart. This is the Function I have made that accepts a bunch of Parameters to create a custom Chart and outputs this to a .PNG file. The data needs to be fed in to the function via a Hash Table (this could be changed) so I also created a “helper” Function called Create-HashTable which also does the work of generating a hash table for use with the Create-Chart Function. You could of course also just feed the Create-Chart function with a manually created HashTable too – this is useful to know because my Create-HashTable function is fairly basic and is not too flexible. Here are a couple of examples of Charts I created using these Functions:

Pie Chart of VMs and their configured Memory Resource settings
The same data but now in a Bar chart
Host Chart created with a manually created Hash Table (Name and MemoryUsageMB Properties)

Download the two functions below to give them a try! Please do suggest any improvements – my parameter handling on the Create-Chart script needs work – they are not specified as mandatory, although all parameters are mandatory – I couldn’t get the Function to work correctly when I did make them mandatory. The Create-HashTable function could also be improved in that at the moment you can only specify Cmdlets for the “Cmdlet” parameter that do not have any double quotation marks inside the cmdlet or any $_ variables. This is because of the way I am using the Invoke-Expression cmdlet inside the function. A simple cmdlet parameter such as “Get-VM | Select Name, MemoryMB” would work just fine for example. Remember that the Create-Chart function needs to be fed with a Hash Table. This could be generated yourself, or by using the Create-HashTable function below. Here are the downloads:

Don’t forget the Microsoft Chart Controls – a requirement to run these functions
Download the functions here:

https://www.shogan.co.uk/wp-content/uploads/Create-Chart.zip

https://www.shogan.co.uk/wp-content/uploads/Create-HashTable.zip

Once you have the Functions loaded, here are some examples to show you how to use them:

Pie Chart of VMs and their MemoryMB setting:

Create-Chart -ChartType Pie -ChartTitle "Sean's Awesome VM Chart" -FileName seanchart3 -XAxisName "VMs" -YAxisName "MemoryMB" -ChartWidth 750 -ChartHeight 650 -DataHashTable (Create-HashTable -Cmdlet "Get-VM" -NameProperty Name -ValueProperty MemoryMB)

Bar Chart of ESXi Hosts and their Memory Usage (MB) values:

Create-Chart -ChartType Bar -ChartTitle "Sean's Awesome Host Chart" -FileName seanchart4 -XAxisName "VM Hosts" -YAxisName "Memory Usage (MB)" -ChartWidth 750 -ChartHeight 650 -DataHashTable (Create-HashTable -Cmdlet "Get-VMHost" -NameProperty Name -ValueProperty MemoryUsageMB)

Use your own Hash Table to input the data:

Create-Chart -ChartType Bar -ChartTitle "Custom Chart" -FileName seanchart5 -XAxisName "My Objects" -YAxisName "My Object Values" -ChartWidth 750 -ChartHeight 650 -DataHashTable $HashTable

So there you have it – a fairly easy way to Chart the data you can get from your PowerCLI or PowerShell cmdlets! I wrote these Functions as part of a larger report that I am working on for another soon to come blog post! As I mentioned above, there is plenty of room for improvement – so if you do make any improvements or changes, please be sure to post them in the comments section.