Hashcat RTX 3090 Benchmarking and Performance

hashcat rtx 3090 benchmarking

I picked up an nVidia RTX 3090 toward the end of last year. In hindsight, I was lucky to have purchased it early on soon after release. The GPU shortage has caused a massive spike in prices and this card is now worth double what I originally paid for it! Anyway, acquisition story aside, I was curious how it would perform in a Hashcat benchmark (all) run. Here are my Hashcat RTX 3090 benchmark results.

For a quick and easy run I’m using the hashcat 6.2.2 (Windows) binary.

.\hashcat.exe -b --benchmark-all
hashcat rtx 3090 benchmark

The performance seems on-par if not slightly higher than some other RTX 3090 benchmarks I have seen around. An impressive set of results.

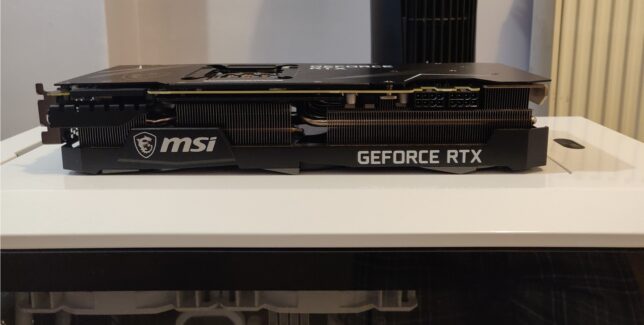
I am running the MSI GeForce RTX 3090 Ventus 3X OC 24GB model card. I upgraded from a GeForce 1080 Ti (12GB) model and the hashing speeds are way faster. The 3090 is a power hungry beast though. It gets hot and the fans are noisier than my 1080 Ti’s were. To ensure my system’s power delivery was up to the task, I also upgraded to a Seasonic Focus PX-850 850W 80+ Platinum at the same time.

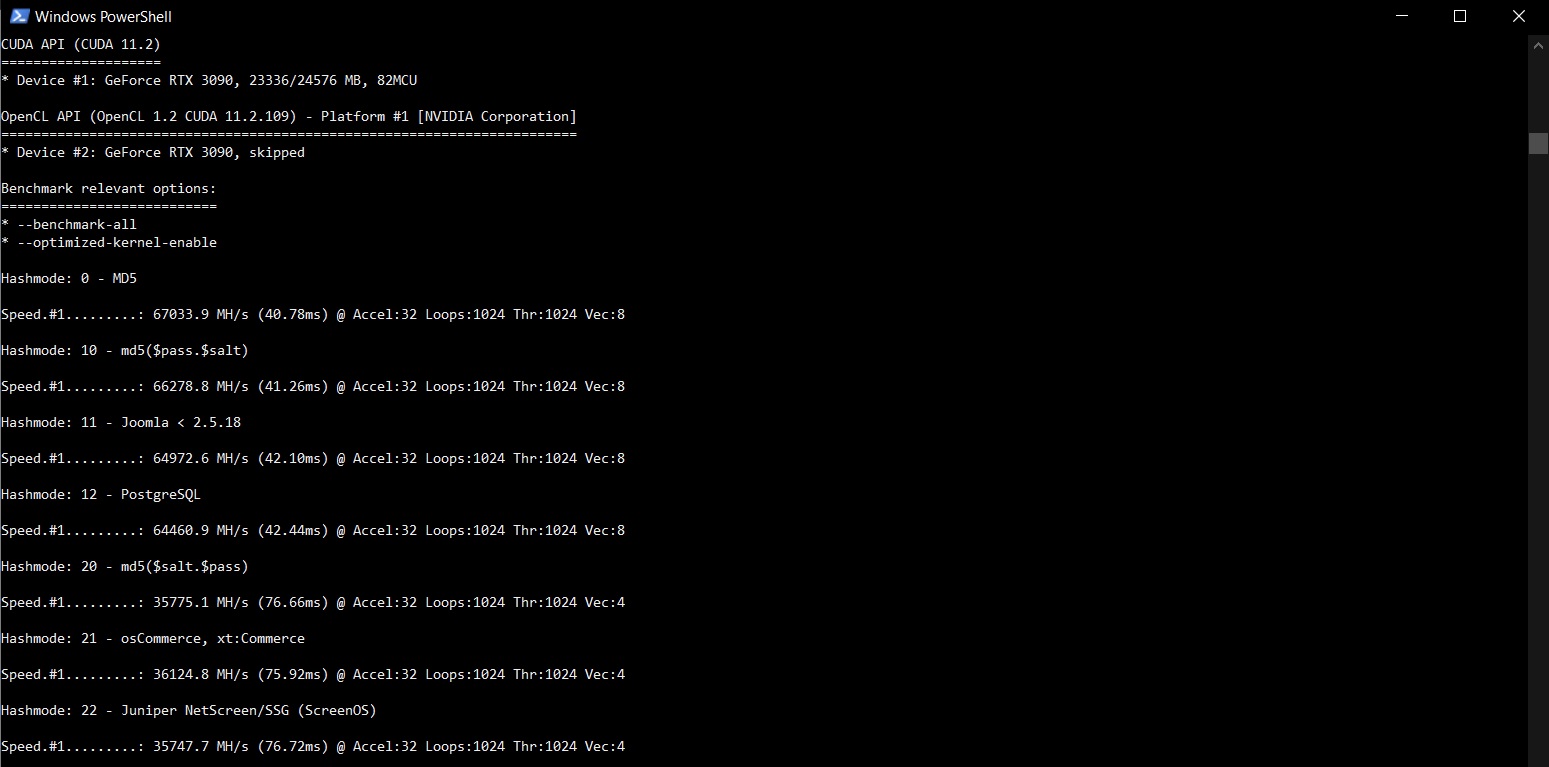
Here is a shortened log of my benchmark –all run:

CUDA API (CUDA 11.2)
====================
* Device #1: GeForce RTX 3090, 23336/24576 MB, 82MCU

OpenCL API (OpenCL 1.2 CUDA 11.2.109) - Platform #1 [NVIDIA Corporation]
========================================================================
* Device #2: GeForce RTX 3090, skipped

Benchmark relevant options:
===========================
* --benchmark-all
* --optimized-kernel-enable

Hashmode: 0 - MD5
Speed.#1.........: 67033.9 MH/s (40.78ms) @ Accel:32 Loops:1024 Thr:1024 Vec:8

Hashmode: 10 - md5($pass.$salt)
Speed.#1.........: 66278.8 MH/s (41.26ms) @ Accel:32 Loops:1024 Thr:1024 Vec:8

Hashmode: 11 - Joomla < 2.5.18
Speed.#1.........: 64972.6 MH/s (42.10ms) @ Accel:32 Loops:1024 Thr:1024 Vec:8

Hashmode: 12 - PostgreSQL
Speed.#1.........: 64460.9 MH/s (42.44ms) @ Accel:32 Loops:1024 Thr:1024 Vec:8

Hashmode: 20 - md5($salt.$pass)
Speed.#1.........: 35775.1 MH/s (76.66ms) @ Accel:32 Loops:1024 Thr:1024 Vec:4

Hashmode: 21 - osCommerce, xt:Commerce
Speed.#1.........: 36124.8 MH/s (75.92ms) @ Accel:32 Loops:1024 Thr:1024 Vec:4

Hashmode: 22 - Juniper NetScreen/SSG (ScreenOS)
Speed.#1.........: 35747.7 MH/s (76.72ms) @ Accel:32 Loops:1024 Thr:1024 Vec:4

Hashmode: 23 - Skype
Speed.#1.........: 35632.9 MH/s (76.96ms) @ Accel:32 Loops:1024 Thr:1024 Vec:4

Hashmode: 24 - SolarWinds Serv-U
Speed.#1.........: 35107.4 MH/s (78.12ms) @ Accel:32 Loops:1024 Thr:1024 Vec:1

Hashmode: 30 - md5(utf16le($pass).$salt)
Speed.#1.........: 65511.3 MH/s (41.73ms) @ Accel:32 Loops:1024 Thr:1024 Vec:4

Hashmode: 40 - md5($salt.utf16le($pass))
Speed.#1.........: 36398.3 MH/s (75.35ms) @ Accel:32 Loops:1024 Thr:1024 Vec:4

Hashmode: 50 - HMAC-MD5 (key = $pass)
Speed.#1.........: 10893.9 MH/s (62.90ms) @ Accel:8 Loops:1024 Thr:1024 Vec:1

Hashmode: 60 - HMAC-MD5 (key = $salt)
Speed.#1.........: 22468.1 MH/s (60.99ms) @ Accel:32 Loops:512 Thr:1024 Vec:1

Hashmode: 70 - md5(utf16le($pass))
Speed.#1.........: 64396.2 MH/s (42.49ms) @ Accel:32 Loops:1024 Thr:1024 Vec:1

Hashmode: 100 - SHA1
Speed.#1.........: 21045.1 MH/s (65.11ms) @ Accel:16 Loops:1024 Thr:1024 Vec:1

Hashmode: 101 - nsldap, SHA-1(Base64), Netscape LDAP SHA
Speed.#1.........: 20874.3 MH/s (65.66ms) @ Accel:16 Loops:1024 Thr:1024 Vec:1

Hashmode: 110 - sha1($pass.$salt)
Speed.#1.........: 21217.0 MH/s (64.60ms) @ Accel:32 Loops:512 Thr:1024 Vec:1

Hashmode: 111 - nsldaps, SSHA-1(Base64), Netscape LDAP SSHA
Speed.#1.........: 20608.3 MH/s (66.51ms) @ Accel:16 Loops:1024 Thr:1024 Vec:1

Full results can be downloaded here:

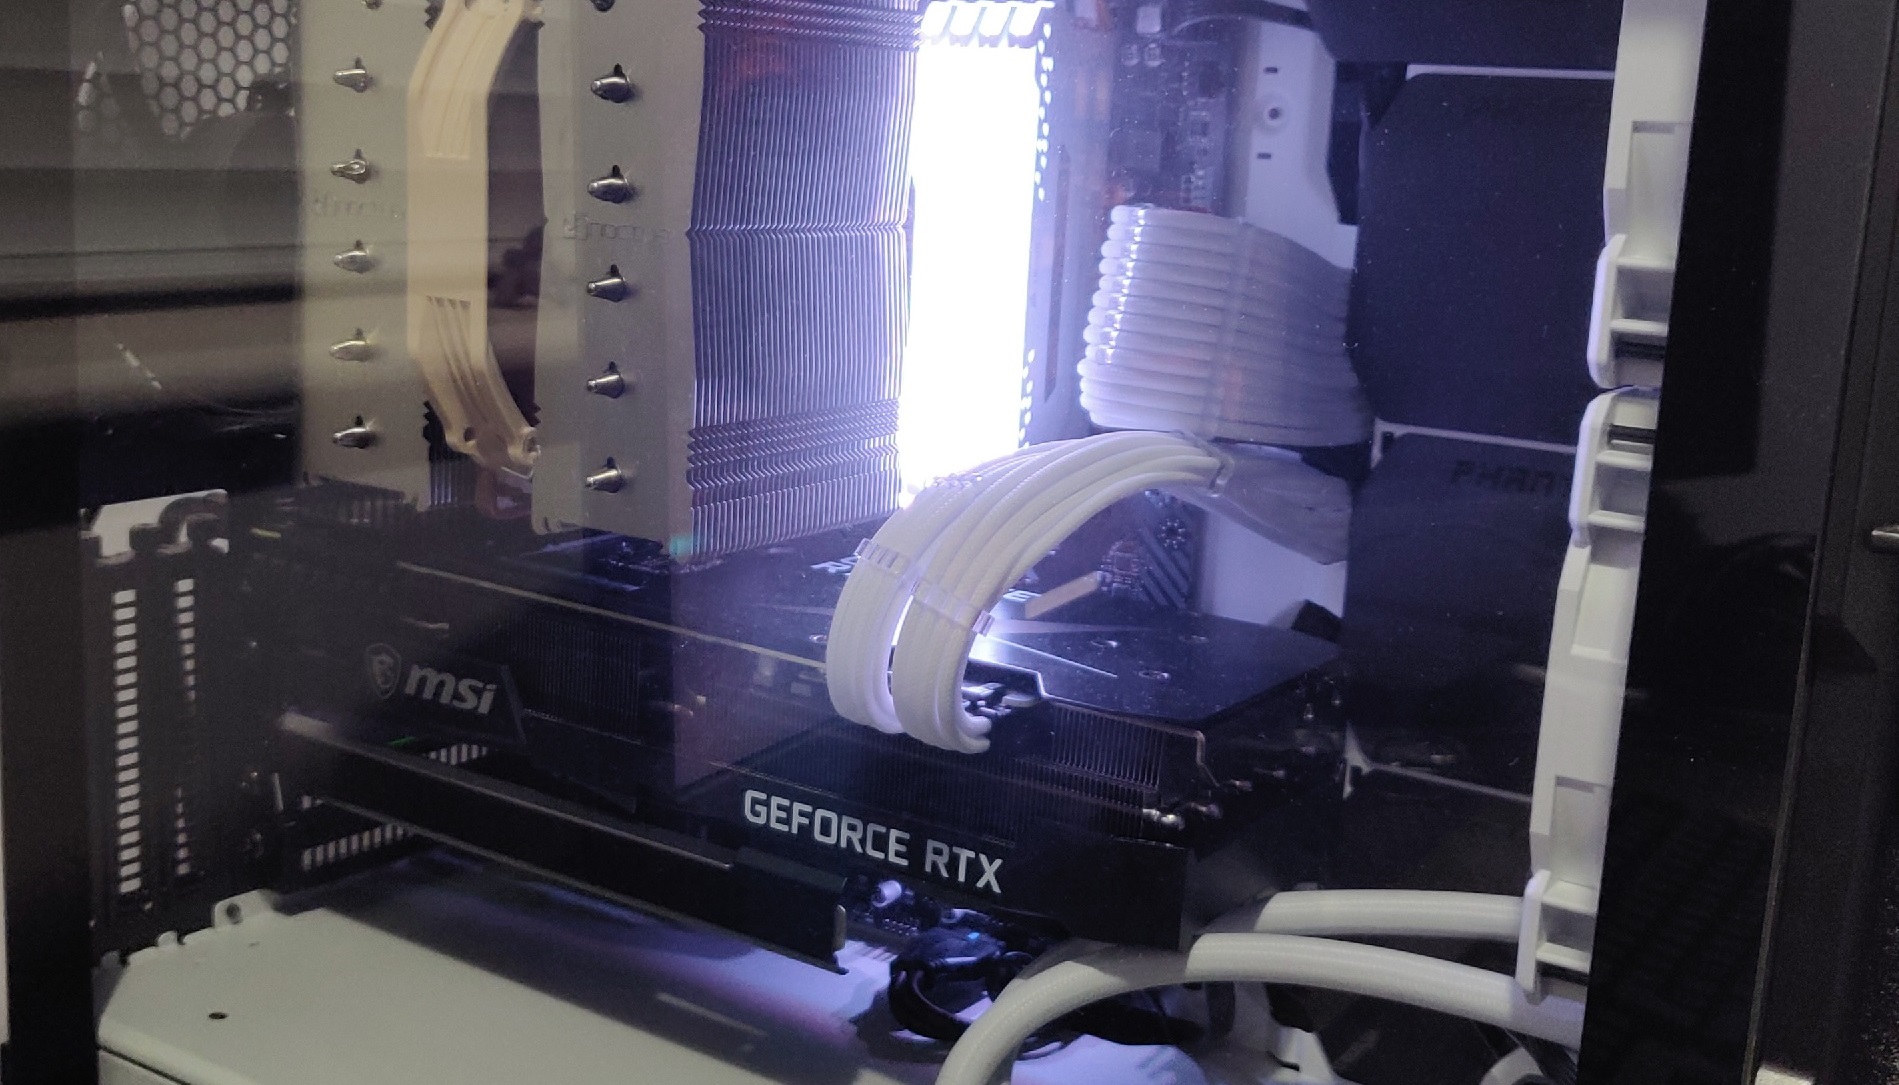
As for the PC build around the RTX 3090, here are a few photos…

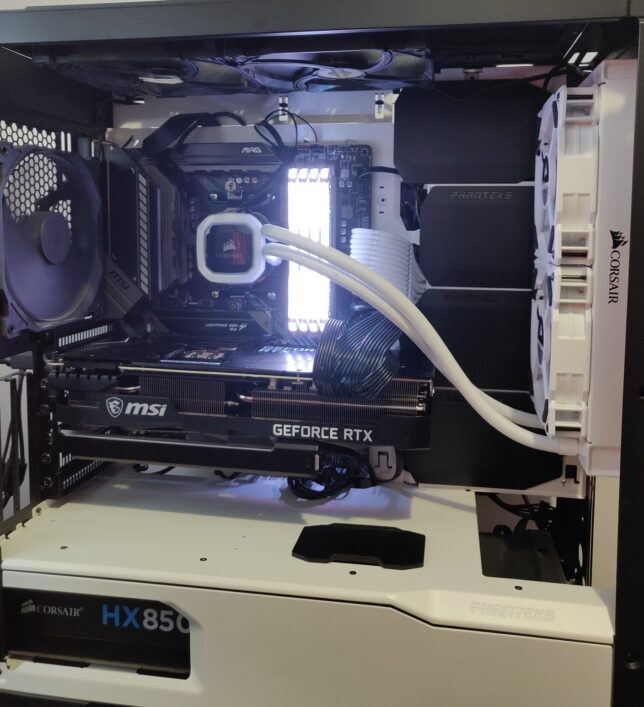
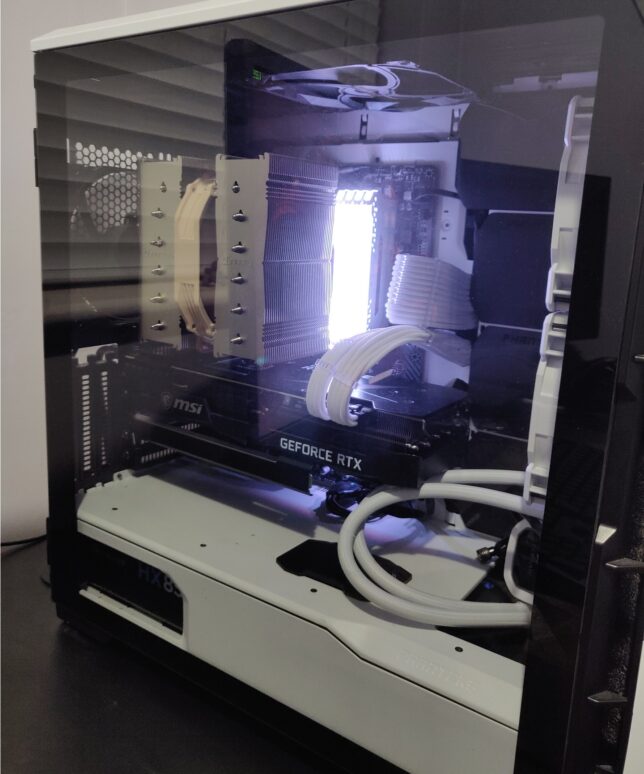
You might notice an AIO installed, but not connected – I was in the process of testing a dual 240mm radiator (AIO) versus a high performing Noctua air cooler, so had left it in the chassis during transition.

I’ll see if I can run the same benchmark suite on my uBuntu install and update the results here. I have not tested the RTX 3090 card under this OS yet so I’m not sure if I’ll run into any driver issues or not.

Funny story of how I ended up with an RTX 3090 (it is a bit overkill!)…

Back in September or October of 2020 (I forget when the 3xxx series launch was), I had pre-ordered the MSI RTX 3080 at MSRP. I was 180 or so in the pre-order queue after months of already waiting. My queue position was barely changing week over week and I got impatient. I saw a handful of RTX 3090 cards come in stock at a local retailer and purchased one.

These cards would generally remain in stock for a few days due to everyone holding out for the much cheaper (at the time) RTX 3080 pre-order promises.

It was a lucky break for me, as those 3080 cards never came for most in that queue. GPU mining and GPU shortages made sure of that. Prices sky rocketed. Looking up this card now I see it costs almost double what I originally paid last year (if you can even get stock that is).

Now I just hope the card lasts at least a few years or more so I don’t ever have to worry about RMA and stock levels…

vSphere 6.0 performance metric limitations in the database (config.vpxd.stats.maxQueryMetrics)

A change I noticed right away between vSphere 5.5 and vSphere 6.0 is the introduction of a default limiter when it comes to performing database queries for performance metrics.

When querying vCenter 6.0 for performance data, there is a system in place by default that limits the number of entities that are included in a database query. As performance charts in the vSphere Web and C# client depend on this performance data, you may sometimes see an error when attempting to view overview or advanced charts because of this change.

In my case, I am using some custom code to query performance metrics using vSphere APIs and noticed the issue right away, as I was trying to gather a large amount of data.

VMware state that the reason for the change is to protect the vCenter database from receiving intensive or large queries.

If you wish to work around this, or remove the limit, you’ll need to introduce a new key/value pair advanced setting in the advanced settings area for your vCenter server instance. The key should be named “config.vpxd.stats.maxQueryMetrics” (without the quotes) and should have a value set of -1 to disable the limit. This could also be set to a value of 100 for example to limit the entities included in a database query to 100.

A further edit should be made to the web.xml file, however in my case I was not concerned with the limit affecting the client, as I was using the API, and making the first change seemed to do the trick for me.

You can read more about this setting by using this link to the official VMware KB article

Solving VMware Fusion 6 and Windows 7 VM performance issues

I have been struggling along with various VM performance issues over the last couple of months using VMware Fusion 5.x, as well as the latest 6.0.3. I just didn’t get the time to dedicate to find a fix for the performance degradation I was seeing until just recently.

I have the following specifications on my Macbook Pro Retina which I use for development purposes:

macspec1

I have a Windows 7 Professional VM running in VMware Fusion, with a spec that I had tried all kinds of different configurations on – mainly 2 vCPUs, and 4GB RAM though. This VM is running on the built-in 256GB SSD.

Nothing seemed to fix the performance issues I was seeing, which was that by at least half way though a typical work day of using Visual Studio and a few tabs of Chrome/IE/Firefox, the VM would slow down to an absolute crawl. I knew it was the VM though, as everything in OSX Mavericks, the host OS was perfectly normal. Most of the time just restarting the Windows VM itself would not help though – I would have to reboot the whole macbook.

The other week I decided enough was enough, and spent a bit of time googling and looking around the VMware Communities forums for a fix. Here is the combination of settings that seems to have resolved my issues now.

  • Settled on a VM spec of 3 x vCPUs (helpful for Visual Studio), and 4GB RAM.
  • Disabled app nap for VMware Fusion (Applications -> Right-click, Get Info on VMware Fusion, and tick the box that says “Prevent App Nap”.
  • Added 3 x new entries into my VM’s configuration file (.vmx file). To edit the .vmx file you’ll need to right-click your VM and select “Show Content”. This will allow you to browse the file content of the VM, and you’ll need to locate your VM’s .vmx file. Right-click this file and open it in your text editor of choice. I added the following lines to the bottom of the file:
MemTrimRate = "0"
sched.mem.pshare.enable = "FALSE"
prefvmx.useRecommendedLockedMemSize = "TRUE"

Don’t forget to disable App Nap for Fusion.

prevent-app-nap
Disable app nap for Fusion

Veeam Backup stats report for all your VM Backup jobs in PowerShell


The other day I was asked to collect some statistics on our Veeam Backup & Recovery server from as many VM Backup jobs as possible. The environment has roughly 70 scheduled jobs thats run either daily or weekly. After searching around a bit first I could not find any current solution or built in method to retrieve the info I needed to collect in a quick or automated way. First ideas were to either somehow grab the info via SQL queries from the Veeam database, or to rather take a sampling of 10-20 different types of jobs and their backup sessions over one normal incremental run day, and one normal full backup day (Manually collecting this data from email reports would be quite a slow process).


After browsing around the Veeam Community Forums I suddenly remembered that there was a PowerShell module that Veeam Include with B&R. I read the basic documentation and got acquainted with a few simple cmdlets.  I wanted to build a report, that would loop through every single Veeam B&R Job we have, and grab data from the last 7 backup sessions of each (daily backups), therefore giving me a good idea of both full backup and incremental backup runs performance, times taken etc… My first attempt at a script got me almost all the way there (tried during spare time in my evenings!) – I was however having trouble matching backup session data with the right day’s backup file stats – sometimes the ordering was out, and I would get metrics back for a backup file that was not from the correct day. Before I was able to resolve this myself, help arrived from “ThomasMc” over at the Veeam Community Forums. (Thanks Thomas!) We got a script together that was able to match up sessions correctly. I then added a few more features, as well as some nice HTML formatting and the ability to grab statistics for all jobs instead of just one sample job. The resulting script gets the following info for you:


  • Index (1 = the last backup sesion, 2 = the day before that, etc)
  • Job Name
  • Start time of job
  • Stop time of job
  • File Name (Allows you to determine if the job was a full or incremental run)
  • Creation Time
  • Average Speed MB – average processing speed of the job
  • Duration – time the job took to complete
  • Result – Success/Warning/Failed (Failed is highlighted in red)


Here is an example of the report run on my Veeam Backup & Recovery Lab environment at home (Thanks to Veeam for the NFR licenses they gave out to VCPs earlier this year!)

 
[download id=”1″]
[download id=”8″]


So, to run the above script, launch a PowerShell session from within Veeam B&R (Tools -> PowerShell). This will make sure your PowerShell session launches with the Veeam Automation/PowerShell snapin. Execute the script and you’ll get an HTML file output to the root of your C:\ drive. By default, all jobs you have in Veeam will be detailed. If you wish to sample a specific job, or a job with a certain word/phrase in it, adjust the -match parameter for the Get-VBRJob cmdlet line near the top of the script. The default setting is an empty string – i.e. “”. To change how many sessions the the script fetches for each backup job, just change the “$sessionstofetch” variable defined at the top of the script.
I have added comments throughout the script for those interested in how it works. Lastly, you could also quite easily modify this script to e-mail you the report, or even run it as a scheduled task. Let me know if you need help doing this and I’ll gladly modify it as required.


Benchmarking – Corsair Reactor R60 SSD vs conventional HDs

So the other day was my first venture into the world of Solid State Storage. I purchased a Corsair Reactor R60. Not the best of SSDs, in fact it is more on the budget side when it comes to SSD storage. It uses a JMicron JMF612 controller and support TRIM provided your OS such as Windows 7 does. The drive was however good value for money in terms of size and performance. Here is a rundown of some of the features straight from Corsair’s site.

  • Maximum sequential read speed 250MB/s
  • Maximum sequential write speed 170MB/s
  • Latest generation JMicron JMF612 controller and MLC NAND flash for fast performance.
  • 128MB DRAM cache for stutter-free performance
  • Internal SATA II connectivity
  • USB 2.0 connectivity for disk cloning or for use as external drive
  • TRIM support (O/S support required)
  • No moving parts for increased durability and reliability and quieter operations over standard hard disk drives
  • Decreased power usage for increased notebook or netbook battery life

I had a clean installation of Windows on my previous OS drive, so I decided it would be a good time to benchmark the SSD against this. I also got hold of some results using the exact same benchmark and scenario but using 8 x Velociraptor 300GB SATA Drives in RAID 60 on a dedicated Areca RAID card. Here are the results. I have used IOmeter for the benchmarking, using a Transfer Request size of 4KB. The results are taken from the Command Queue Depth of 4 results in each instance.

I must say that I am extremely impressed with this SSD. Even for budget / mid range drive, it is phenomenally fast when comparing it to conventional HD storage. Windows loads much quicker and so do the games that I have installed on it. Everything snaps open as the drive is able to access any area of storage almost instantly. File copying performance is also extremely impressive. Even when comparing to a high end RAID controller with multiple high speed Velociraptor drives spinning at 15000rpm in RAID, this drive pulls ahead in all benchmarks. As a dedicated OS / Application drive, I would definitely recommend one.

Next up, I think I am going to try this drive out as dedicated VM storage drive and see how VMDKs perform on it!