Setting up Helm for Kubernetes (with RBAC) and Deploying Your First Chart

I was pointed to Helm the other day and decided to have a quick look at it. I tasked myself with setting it up in a sandbox environment and deploying a pre-packaged application (a.k.a chart, or helm package) into my Kubernetes sandbox environment.

Helm 101

The best way to think about Helm is as a ‘package manager for Kubernetes’. You install Helm as a cli tool (It’s written in Golang) and all the operations it provides to you, you’ll find are very similar to those of common package managers like npm etc…

Helm has a few main concepts.

  • As mentioned above, a ‘Chart’ is a package for Helm. It contains the resource definitions required to run an app/tool/service on a Kubernetes cluster.
  • A ‘Repository’ is where charts are stored and shared from
  • A ‘Release’ is an instance of a chart running in your Kubernetes cluster. You can create multiple releases for multiple instances of your app/tool/service.

More info about Helm and it’s concepts can be found on the Helm Quickstart guide. If however, you wish to get stuck right in, read on…

This is a quick run-down of the tasks involved in setting it up and deploying a chart (I tried out kube-slack to provide slack notifications for failed kubernetes operations in my sandbox environment to my slack channel).

Setting up Helm

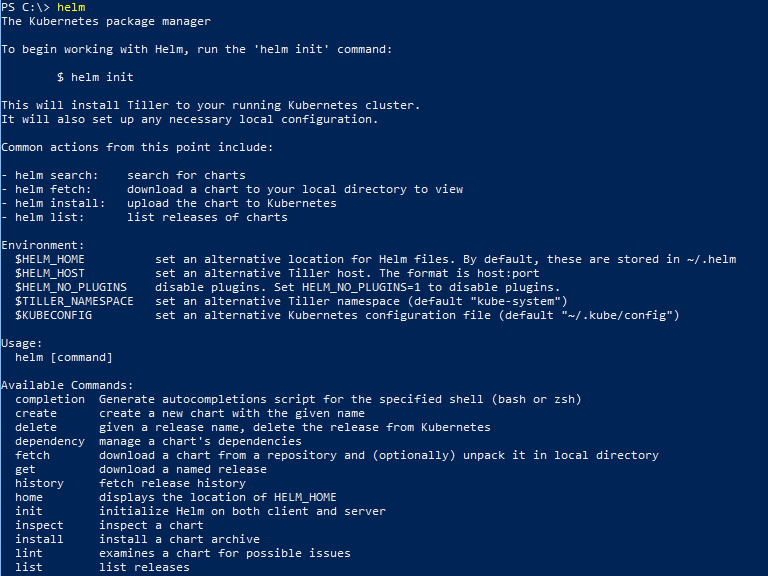
Download and unzip the latest Helm binary for your OS. I’m using Windows so I grabbed that binary, unblocked it, and put in a folder found in my path. Running a PowerShell session I can simply type:

helm

Helm executes and provides a list of possible options.

Before you continue with initialising Helm, you should create a service account in your cluster that Helm will use to manage releases across namespaces (or in a particular namespace you wish it to operate in). For testing its easiest to set up the service account to use the default built-in “cluster-admin” role. (To be more secure you should set up Tiller to have restricted permissions and even restrict it based on namespace too).

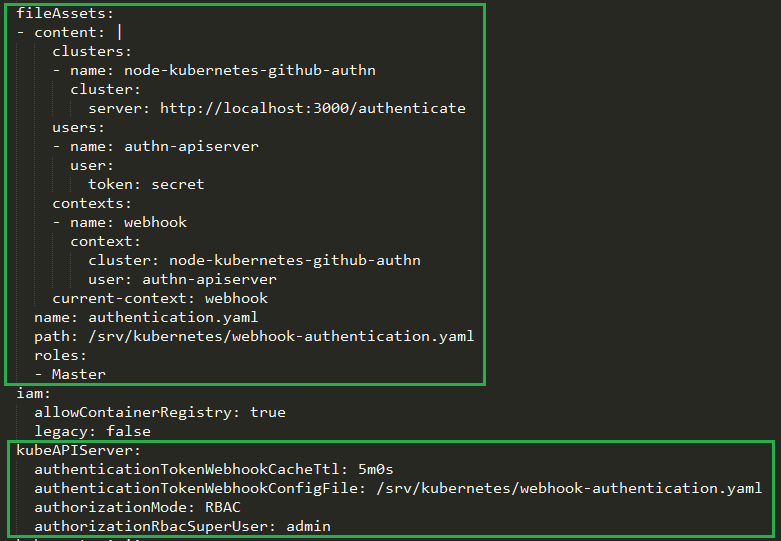
To setup the basic SA with the cluster-admin role, you’ll need a ClusterRoleBinding to go with the SA. Here is the config you need to set both up.

apiVersion: v1
kind: ServiceAccount
metadata:
  name: tillersa
  namespace: kube-system
---
apiVersion: rbac.authorization.k8s.io/v1beta1
kind: ClusterRoleBinding
metadata:
  name: tillersa-clusterrolebinding
roleRef:
  apiGroup: rbac.authorization.k8s.io
  kind: ClusterRole
  name: cluster-admin
subjects:
  - kind: ServiceAccount
    name: tillersa
    namespace: kube-system

Run kubectl create and point to this config to set up the SA and ClusterRoleBinding:

kubectl create -f .\tillersa-and-cluster-rolebinding.yaml

Now you can do a helm initialisation.

helm init --service-account tillersa --tiller-namespace kube-system

If all went well, you’ll get a message stating it was initialised and setup in your cluster.

Run:

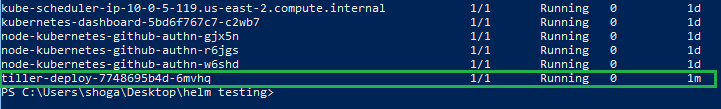
kubectl get pods -n=kube-system

and you should see your new tiller-deploy pod running.

Deploying Charts with Helm

Run helm list to see that you currently have no chart releases deployed.

helm list

You can search the public Helm repository for charts (applications/tools/etc) that you can now easily deploy into your cluster.

helm search

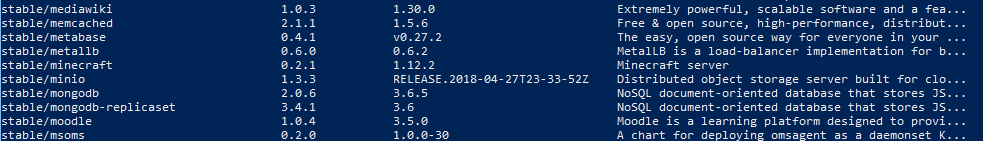
Search for ‘grafana’ with helm. We’ll deploy that to the cluster in this example.

helm search grafana

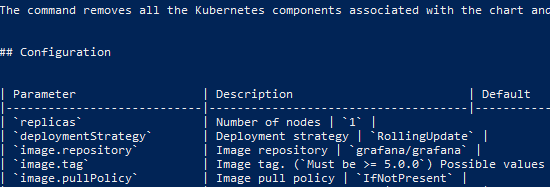
Next up you might want to inspect and discover more about the chart you’re going to install. This is useful to see what sort of configuration parameters you can pass to it to customise it to your requirements.

helm inspect grafana

Choose a namespace in your cluster to deploy to and a service type for Grafana (to customise it slightly to your liking) and then run the following, replacing the service.type and service.port values for your own. For example you could use a ClusterIP service instead of LoadBalancer like I did:

helm install --name sean-grafana-release stable/grafana --set service.type=LoadBalancer --set service.port=8088 --namespace sean-dev

Helm will report back on the deployment it started for your release.

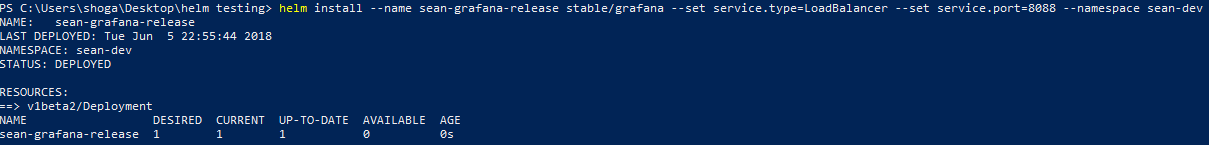
The command is not synchronous so you can run helm status to report on the status of a release.

helm status sean-grafana-release

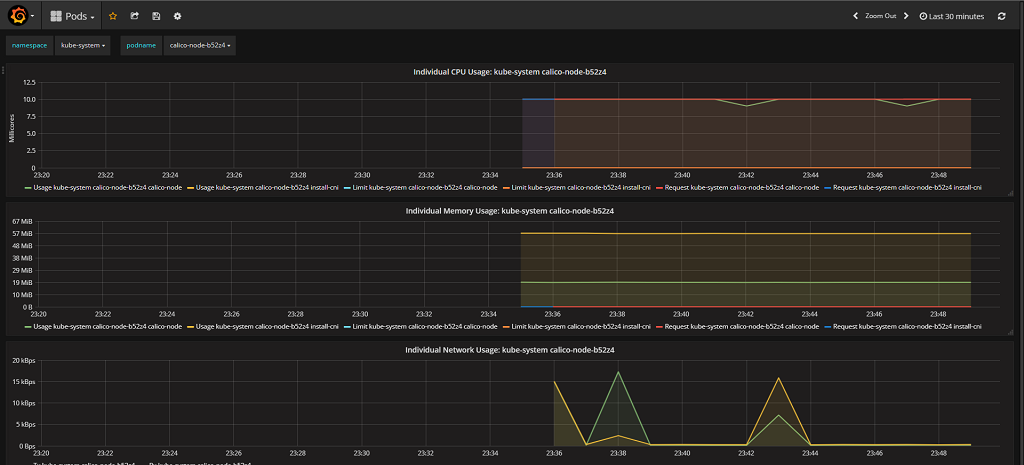
Check on deployments in your namespace with kubectl or the Kubernetes dashboard and you should find Grafana running happily along.

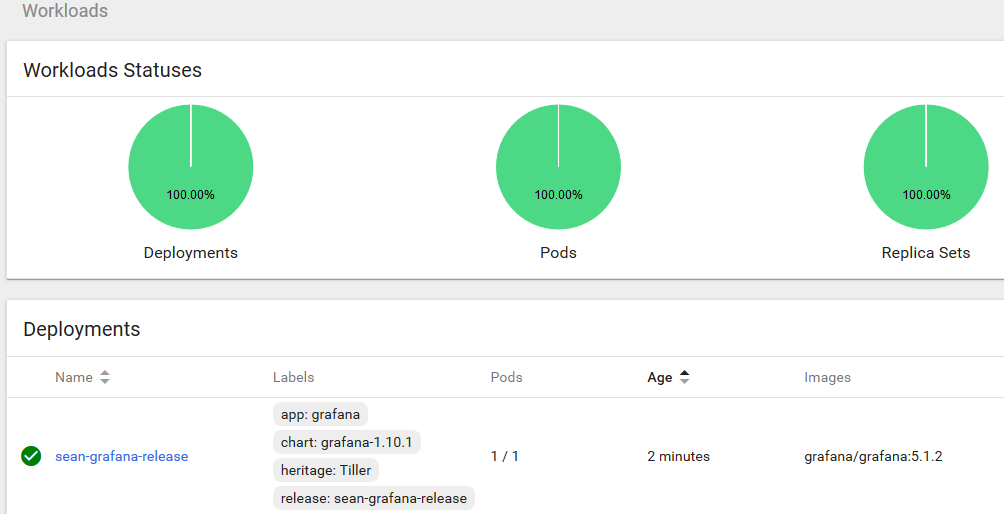
In my case I used a LoadBalancer service, so my cluster being AWS based spun up an ELB to front Grafana. Checking the ELB endpoint on port 8088 as I specified in my Helm install command sure enough shows my new Grafana app’s login page.

The chart ensures all the necessary components are setup and created in your cluster to run Grafana. Things like the deployment, the service, service account, secrets, etc..

In this case the chart outputs instructions on how to retrieve your Grafana admin password for login. You can see how to get that in the output of your release.

Tidy Up

To clean up and delete your release simply do:

helm delete sean-grafana-release

Concluding

Done!

There is plenty more to explore with helm. If you wish to change your helm configuration with helm init, look into using the –upgrade parameter. helm reset can be used to remove Helm from your cluster and there are many many more options and scenarios that could be covered.

Explore further with the helm command to see available commands and do some digging.

Next up for me I’ll be looking at converting one of my personal applications into a chart that I can deploy into Kubernetes.

Custom Kubernetes Webhook Token Authentication with Github (a NodeJS implementation)

Introduction

Recently I was tasked with setting up a couple of new Kubernetes clusters for a team of developers to begin transitioning an older .NET application over to .NET Core 2.0. Part of my this work lead me down the route of trying out some different authentication strategies.

I ended on RBAC being a good solution for our needs allowing for nice role based permission flexibility, but still needed a way of handling authentication for users of the Kubernetes clusters. One of the options I looked into here was to use Kubernetes’ support for webhook token authentication.

Webhook token authentication allows a remote service to authenticate with the cluster, meaning we could hand off some of the work / admin overhead to another service that implements part of the solution already.

Testing Different Solutions

I found an interesting post about setting up Github with a custom webhook token authentication integration and tried that method out. It works quite nicely and some good benefits as discussed in the post linked before, but summarised below:

  • All developers on the team already have their own Github accounts.
  • Reduces admin overhead as users can generate their own personal tokens in their Github account and can manage (e.g. revoke/re-create) their own tokens.
  • Flexible as tokens can be used to access Kubernetes via kubectl or the Dashboard UI from different machines
  • An extra one I thought of – Github teams could potentially be used to group users / roles in Kubernetes too (based on team membership)

As mentioned before, I tried out this custom solution which was written in Go and was excited about the potential customisation we could get out of it if we wanted to expand on the solution (see my last bullet point above).

However, I was still keen to play around with Kubernetes’ Webhook Token Authentication a bit more and so decided to reimplement this solution in a language I am more familiar with. .NET Core would have been a good candidate, but I didn’t have a lot of time at hand and thought doing this in NodeJS would be quicker.

With that said, I rewrote the Github Webhook Token Authenticator service in NodeJS using a nice lightweight node alpine base image and set things up for Docker builds. Basically readying it for deployment into Kubernetes.

Implementing the Webhook Token Authenticator service in NodeJS

The Webhook Token Authentication Service simply implements a webhook to verify tokens passed into Kubernetes.

On the Kubernetes side you just need to deploy the DaemonSet with this authenticator docker image, run your API servers with RBAC enabled

Create a DaemonSet to run the NodeJS webhook service on all relevant master nodes in your cluster.

Here is the DaemonSet configuration already setup to point to the correct docker hub image.

Deploy it with:

kubectl create -f .\daemonset.yaml

Use the following configurations to start your API servers with:

authentication-token-webhook-config-file
authentication-token-webhook-cache-ttl

Update your cluster spec to add a fileAsset entry and also point to the authentication token webhook config file that will be put in place by the fileAsset using the kubeAPIServer config section.

You can get the fileAsset content in my Github repository here.

Here is how the kubeAPIServer and fileAssets sections should look once done. (I’m using kops to apply these configurations to my cluster in this example).

You can then set up a ClusterRole and ClusterRoleBinding along with usernames that match your users’ actual Github usernames to set up RBAC permissions. (Going forward it would be great to hook up the service to work with Github teams too.)

Here is an example ClusterRole that provides blanket admin access as a simple example.

kind: ClusterRole
apiVersion: rbac.authorization.k8s.io/v1
metadata:
  name: youradminsclusterrole
rules:
  - apiGroups: ["*"]
    resources: ["*"]
    verbs: ["*"]
  - nonResourceURLs: ["*"]
    verbs: ["*"]

Hook up the ClusterRole with a ClusterRoleBinding like so (pointing the user parameter to the name of your github user account you’re binding to the role):

kubectl create clusterrolebinding yourgithubusernamehere-admin-binding --clusterrole=youradminsclusterrole --user=yourgithubusernamehere

Don’t forget to create yourself (in your Github account), a personal access token. Update your .kube config file to use this token as the password, or login to the Kubernetes Dashboard UI and select “Token” as the auth method and drop your token in there to sign in.

The auth nodes running in the daemonset across cluster API servers will handle the authentication via your newly configured webhook authentication method, go over to Github, check that the token belongs to the user in the ClusterRoleBinding (of the same github username) and then use RBAC to allow access to the resources specified in your ClusterRole that you bound that user to. Job done!

For more details on how to build the NodeJS Webhook Authentication Docker image and get it deployed into Kubernetes, or to pull down the code and take a look, feel free to check out the repository here.

Provision your own Kubernetes cluster with private network topology on AWS using kops and Terraform – Part 2

Getting Started

If you managed to follow and complete the previous blog post, then you managed to get a Kubernetes cluster up and running in your own private AWS VPC using kops and Terraform to assist you.

In this blog post, you’ll cover following items:

  • Setup upstream DNS for your cluster
  • Get a Kubernetes Dashboard service and deployment running
  • Deploy a basic metrics dashboard for Kubernetes using heapster, InfluxDB and Grafana

Upstream DNS

In order for services running in your Kubernetes cluster to be able to resolve services outside of your cluster, you’ll now configure upstream DNS.

Containers that are started in the cluster will have their local resolv.conf files automatically setup with what you define in your upstream DNS config map.

Create a ConfigMap with details about your own DNS server to use as upstream. You can also set some external ones like Google DNS for example (see example below):

apiVersion: v1
kind: ConfigMap
metadata:
  name: kube-dns
  namespace: kube-system
data:
  stubDomains: |
    {"yourinternaldomain.local": ["10.254.1.1"]}
  upstreamNameservers: |
    ["10.254.1.1", "8.8.8.8", "8.8.4.4"]

Save your ConfigMap as kube-dns.yaml and apply it to enable it.

kubectl apply -f kube-dns.yaml

You should now see it listed in Config Maps under the kube-system namespace.

Kubernetes Dashboard

Deploying the Kubernetes dashboard is as simple as running one kubectl command.

kubectl apply -f https://raw.githubusercontent.com/kubernetes/dashboard/master/src/deploy/recommended/kubernetes-dashboard.yaml

You can then start a dashboard proxy using kubectl to access it right away:

kubectl proxy

Head on over to the following URL to access the dashboard via the proxy you ran:

http://localhost:8001/api/v1/namespaces/kube-system/services/https:kubernetes-dashboard:/proxy/

You can also access the Dashboard via the API server internal elastic load balancer that was set up in part 1 of this blog post series. E.g.

https://your-internal-elb-hostname/api/v1/namespaces/kube-system/services/https:kubernetes-dashboard:/proxy/#!/overview?namespace=default

Heapster, InfluxDB and Grafana (now deprecated)

Note: Heapster is now deprecated and there are alternative options you could instead look at, such as what the official Kubernetes git repo refers you to (metrics-server). Nevertheless, here are the instructions you can follow should you wish to enable Heapster and get a nice Grafana dashboard that showcases your cluster, nodes and pods metrics…

Clone the official Heapster git repo down to your local machine:

git clone https://github.com/kubernetes/heapster.git

Change directory to the heapster directory and run:

kubectl create -f deploy/kube-config/influxdb/
kubectl create -f deploy/kube-config/rbac/heapster-rbac.yaml

These commands will essentially launch deployments and services for grafana, heapster, and influxdb.

The Grafana service should attempt to get a LoadBalancer from AWS via your Kubernetes cluster, but if this doesn’t happen, edit the monitoring-grafana service YAML configuration and change the type to LoadBalancer. E.g.

"type": "LoadBalancer",

Save the monitoring-grafana service definition and your cluster should automatically provision a public facing ELB and set it up to point to the Grafana pod.

Note: if you want it available on an internal load balancer instead, you’ll need to create your grafana service using the aws-load-balancer-internal annotation instead.

Grafana dashboard for Kubernetes with Heapster

Now that you have Heapster running, you can also get some metrics displayed directly in your Kubernetes dashboard too.

You may need to restart the dashboard pods to access the new performance stats in the dashboard though. If this doesn’t work, delete the dashboard deployment, service, pods, role, and then re-deploy the dashboard using the same process you followed earlier.

Once its up and running, use the DNS for the new ELB to access grafana’s dashboard, login with admin/admin and change the default admin password to something secure and save. You can now access cluster stats/performance stats in kubernetes, as well as in Grafana.

Closing off

This concludes part two of this series. To sum up, you managed to configure upstream DNS, deploy the Kubernetes dashboard and set up Heapster to allow you to see metrics in the dashboard, as well as deploying InfluxDB for storing the metric data with Grafana as a front end service for viewing dashboards.

Provision your own Kubernetes cluster with private network topology on AWS using kops and Terraform – Part 1

Goals

In this post series I’ll be covering how to provision a brand new self-hosted Kubernetes environment provisioned into AWS (on top of EC2 instances) with a specific private networking topology as follows:

  • Deploy into an existing VPC
  • Use existing VPC Subnets
  • Use private networking topology (Calico), with a private/internal ELB to access the API servers/cluster
  • Don’t use Route 53 AWS DNS services or external DNS, instead use Kubernetes gossip DNS service for internal cluster name resolution, and allow for upstream DNS to be set up to your own private DNS servers for outside-of-cluster DNS lookups

This is a more secure set up than a more traditional / standard kops provisioned Kubernetes cluster,  placing API servers on a private subnet, yet still allows you the flexibility of using Load Balanced services in your cluster to expose web services or APIs for example to the public internet if you wish.

Set up your workstation with the right tools

You need a Linux or MacOS based machine to work from (management station/machine). This is because kops only runs on these platforms right now.

sudo apt install python-pip
  • Use pip to install the awscli
pip install awscli --upgrade --user
  • Create yourself an AWS credentials file (~/.aws/credentials) and set it up to use an access and secret key for your kops IAM user you created earlier.
  • Setup the following env variables to reference from, but make sure you fill in the values you require for this new cluster. So change the VPC ID, S3 state store bucket name, and cluster NAME.
export ZONES=us-east-1b,us-east-1c,us-east-1d
export KOPS_STATE_STORE=s3://your-k8s-state-store-bucket
export NAME=yourclustername.k8s.local
export VPC_ID=vpc-yourvpcidgoeshere
  • Note for the above exports above, ZONES is used to specify where the master nodes in the k8s cluster will be placed (Availability Zones). You’ll definitely want these spread out for maximum availability

Set up your S3 state store bucket for the cluster

You can either create this manually, or create it with Terraform. Here is a simple Terraform script that you can throw into your working directory to create it. Just change the name of the bucket to your desired S3 bucket name for this cluster’s state storage.

Remember to use the name for this bucket that you specified in your KOPS_STATE_STORE export variable.

resource "aws_s3_bucket" "state_store" {
  bucket        = "${var.name}-${var.env}-state-store"
  acl           = "private"
  force_destroy = true

  versioning {
    enabled = true
  }

  tags {
    Name        = "${var.name}-${var.env}-state-store"
    Infra       = "${var.name}"
    Environment = "${var.env}"
    Terraformed = "true"
  }
}

Terraform plan and apply your S3 bucket if you’re using Terraform, passing in variables for name/env to name it appropriately…

terraform plan
terraform apply

Generate a new SSH private key for the cluster

  • Generate a new SSH key. By default it will be created in ~/.ssh/id_rsa
ssh-keygen -t rsa

Generate the initial Kubernetes cluster configuration and output it to Terraform script

Use the kops tool to create a cluster configuration, but instead of provisioning it directly, you’ll output it to terraform script. This is important, as you’ll be wanting to change values in this output file to provision the cluster into existing VPC and subnets. You also want to change the ELB from a public facing ELB to internal only.

kops create cluster --master-zones=$ZONES --zones=$ZONES --topology=private --networking=calico --vpc=$VPC_ID --target=terraform --out=. ${NAME}

Above you ran the kops create cluster command and specified to use a private topology with calico networking. You also designated an existing VPC Id, and told the tool to create terraform script as the output in the current directory instead of actually running the create cluster command against AWS right now.

Change your default editor for kops if you require a different one to vim. E.g for nano:

set EDITOR=nano

Edit the cluster configuration:

kops edit cluster ${NAME}

Change the yaml that references the loadBalancer value as type Public to be Internal.

While you are still in the editor for the cluster config, you need to also change the entire subnets section to reference your existing VPC subnets, and egress pointing to your NAT instances. Remove the current subnets section, and add the following template, (updating it to reference your own private subnet IDs for each region availability zone, and the correct NAT instances for each too. (You might possibly use one NAT instance for all subnets or you may have multiple). The Utility subnets should be your public subnets, and the Private subnets your private ones of course. Make sure that you reference subnets for the correct VPC you are deploying into.

subnets:
- egress: nat-2xcdc5421df76341
  id: subnet-b32d8afg
  name: us-east-1b
  type: Private
  zone: us-east-1b
- egress: nat-04g7fe3gc03db1chf
  id: subnet-da32gge3
  name: us-east-1c
  type: Private
  zone: us-east-1c
- egress: nat-0cd542gtf7832873c
  id: subnet-6dfb132g
  name: us-east-1d
  type: Private
  zone: us-east-1d
- id: subnet-234053gs
  name: utility-us-east-1b
  type: Utility
  zone: us-east-1b
- id: subnet-2h3gd457
  name: utility-us-east-1c
  type: Utility
  zone: us-east-1c
- id: subnet-1gvb234c
  name: utility-us-east-1d
  type: Utility
  zone: us-east-1d
  • Save and exit the file from your editor.
  • Output a new terraform config over the existing one to update the script based on the newly changed ELB type and subnets section.
kops update cluster --out=. --target=terraform ${NAME}
  • The updated file is now output to kubernetes.tf in your working directory
  • Run a terraform plan from your terminal, and make sure that the changes will not affect any existing infrastructure, and will not create or change any subnets or VPC related infrastructure in your existing VPC. It should only list out a number of new infrastructure items it is going to create.
  • Once happy, run terraform apply from your terminal
  • Once terraform has run with the new kubernetes.tf file, the certificate will only allow the standard named cluster endpoint connection (cert only valid for api.internal.clustername.k8s.local for example). You now need to re-run kops update and output to terraform again.
kops update cluster $NAME --target=terraform --out=.
  • This will update the cluster state in your S3 bucket with new certificate details, but not actually change anything in the local kubernetes.tf file (you shouldn’t see any changes here). However you can now run a rolling update rolling update with the cloudonly and force –yes options:
kops rolling-update cluster $NAME --cloudonly --force --yes

This will roll all the masters and nodes in the cluster (the created autoscaling groups will initialise new nodes from the launch configurations) and when the ASGs initiate new instances, they’ll get the new certs applied from the S3 state storage bucket. You can then access the ELB endpoint on HTTPS, and you should get an auth prompt popup.

Find the endpoint on the internal ELB that was created. The rolling update may take around 10 minutes to complete, and as mentioned before, will terminate old instances in the Autoscaling group and bring new instances up with the new certificate configuration.

Tag your public subnets to allow auto provisioning of ELBs for Load Balanced Services

In order to allow Kubernetes to automatically create load balancers (ELBs) in AWS for services that use the LoadBalancer configuration, you need to tag your utility subnets with a special tag to allow the cluster to find these subnets automatically and provision ELBs for any services you create on-the-fly.

Tag the subnets that you are using as utility subnets (public) with the following tag:

Key: kubernetes.io/role/elb Value: (Don’t add a value, leave it blank)

Tag your private subnets for internal-only ELB provisioning for Load Balanced Services

In order to allow Kubernetes to automatically create load balancers (ELBs) in AWS for services that use the LoadBalancer configuratio and a private facing configuration, you need to tag the private subnets that the cluster operates in with a special tag to allow k8s to find these subnets automatically.

Tag the subnets that you are using as private (where your nodes and master nodes should be running now) with the following two tags:

Key: kubernetes.io/cluster/{yourclusternamehere.k8s.local} Value: shared
Key: kubernetes.io/role/internal-elb Value: 1

As an example for the above, the key might end up with a value of “kubernetes.io/cluster/yourclusternamehere.k8s.local” if your cluster is named “yourclusternamehere.k8s.local” (remember you named your cluster when you created your local workstation EXPORT value for {NAME}.

Closing off

This concludes part one of this series for now.

As a summary, you should now have a kubernetes cluster up and running in your private subnets, spread across availability zones, and you’ve done it all using kops and Terraform.

Straighten things out by creating a git repository, and commiting your terraform artifacts for the cluster and storing them in version control. Watch out for the artifacts that kops output along with the Terraform script like the private certificate files – these should be kept safe.

Part two should be coming soon, where we’ll run through some more tasks to continue setting the cluster up like setting upstream DNS, provisioning the Kubernetes Dashboard service/pod and more…