Fast Batch S3 Bucket object deletion from the shell

This is a quick post showing a nice and fast batch S3 bucket object deletion technique.

I recently had an S3 bucket that needed cleaning up. It had a few million objects in it. With path separating forward slashes this means there were around 5 million or so keys to iterate.

The goal was to delete every object that did not have a .zip file extension. Effectively I wanted to leave only the .zip file objects behind (of which there were only a few thousand), but get rid of all the other millions of objects.

My first attempt was straight forward and naive. Iterate every single key, check that it is not a .zip file, and delete it if not. However, every one of these iterations ended up being an HTTP request and this turned out to be a very slow process. Definitely not fast batch S3 bucket object deletion…

I fired up about 20 shells all iterating over objects and deleting like this but it still would have taken days.

I then stumbled upon a really cool technique on serverfault that you can use in two stages.

  1. Iterate the bucket objects and stash all the keys in a file.
  2. Iterate the lines in the file in batches of 1000 and call delete-objects on these – effectively deleting the objects in batches of 1000 (the maximum for 1 x delete request).

In-between stage 1 and stage 2 I just had to clean up the large text file of object keys to remove any of the lines that were .zip objects. For this process I used sublime text and a simple regex search and replace (replacing with an empty string to remove those lines).

So here is the process I used to delete everything in the bucket except the .zip objects. This took around 1-2 hours for the object key path collection and then the delete run.

Get all the object key paths

Note you will need to have Pipe Viewer installed first (pv). Pipe Viewer is a great little utility that you can place into any normal pipeline between two processes. It gives you a great little progress indicator to monitor progress in the shell.

aws s3api list-objects --output text --bucket the-bucket-name-here --query 'Contents[].[Key]' | pv -l > all-the-stuff.keys


Remove any object key paths you don’t want to delete

Open your all-the-stuff.keys file in Sublime or any other text editor with regex find and replace functionality.

The regex search for sublime text:

^.*.zip*\n

Find and replace all .zip object paths with the above regex string, replacing results with an empty string. Save the file when done. Make sure you use the correctly edited file for the following deletion phase!

Iterate all the object keys in batches and call delete

tail -n+0 all-the-stuff.keys | pv -l | grep -v -e "'" | tr '\n' '\0' | xargs -0 -P1 -n1000 bash -c 'aws s3api delete-objects --bucket the-bucket-name-here --delete "Objects=[$(printf "{Key=%q}," "$@")],Quiet=false"' _

This one-liner effectively:

  • tails the large text file (mine was around 250MB) of object keys
  • passes this into pipe viewer for progress indication
  • translates (tr) all newline characters into a null character ‘\0’ (effectively every line ending)
  • chops these up into groups of 1000 and passes the 1000 x key paths as an argument with xargs to the aws s3api delete-object command. This delete command can be passed an Objects array parameter, which is where the 1000 object key paths are fed into.
  • finally quiet mode is disabled to show the result of the delete requests in the shell, but you can also set this to true to remove that output.

Effectively you end up calling aws s3api delete-object passing in 1000 objects to delete at a time.

This is how it can get through the work so quickly.

Nice!

Troubleshooting Amazon EKS Worker Nodes not joining the cluster

mechanic underneath car fixing things

I’ve recently been doing a fair bit of automation work on bringing up AWS managed Kubernetes clusters using Terraform (with Packer for building out the worker group nodes). Read on for some handy tips on troubleshooting EKS worker nodes.

Some of my colleagues have not worked with EKS (or Kubernetes) much before and so I’ve also been sharing knowledge and helping others get up to speed. A colleague was having trouble with their newly provisioned personal test EKS cluster found that the kube-system / control plane related pods were not starting.  I assisted with the troubleshooting process and found the following…

Upon diving into the logs of the kube-system related pods (dns, aws CNI, etc…) it was obvious that the pods were not being scheduled on the brand new cluster. The next obvious command to run was kubectl get nodes -o wide to take a look at the general state of the worker nodes.

Unsurprisingly there were no nodes in the cluster.

Troubleshooting worker nodes not joining the cluster

The first thing that comes to mind when you have worker nodes that are not joining the cluster on startup is to check the bootstrapping / startup scripts. In EKS’ case (and more specifically EC2) the worker nodes should be joining the cluster by running a couple of commands in the userdata script that the EC2 machines run on launch.

If you’re customising your worker nodes with your own custom AMI(s) then you’ll most likely be handling this userdata script logic yourself, and this is the first place to check.

The easiest way of checking userdata script failures on an EC2 instance is to simply get the cloud-init logs direct from the instance. Locate the EC2 machine in the console (or the instance-id inspect the logs for failures on the section that logs execution of your userdata script.

  • In the EC2 console: Right-click your EC2 instance -> Instance Settings -> Get System Log.
  • On the instance itself:
    • cat /var/log/cloud-init.log | more
    • cat /var/log/cloud-init-output.log | more

Upon finding the error you can then check (using intuition around the specific error message you found):

  • Have any changes been introduced lately that might have caused the breakage?
  • Has the base AMI that you’re building on top of changed?
  • Have any resources that you might be pulling into the base image builds been modified in any way?

These are the questions to ask and investigate first. You should be storing base image build scripts (packer for example) in version control / git, so check the recent git commits and image build logs first.

How to setup a basic Kubernetes cluster and add an NGINX Ingress Controller on DigitalOcean

Most of the steps in this how to post can be applied to any Kubernetes cluster to get an NGINX Ingress Controller deployed, so you don’t necessarily have to be running Kubernetes in DigitalOcean. With that said, let’s go through the process of setting up a Kubernetes cluster with NGINX Ingress Controller on DigitalOcean.

DigitalOcean have just officially announced their own Kubernetes offering so this guide covers initial deployment of a basic worker node pool on DigitalOcean, and then moves on to deploying an Ingress Controller setup.

If you’re thinking of signing up on DigitalOcean, consider using my referral link below. It’ll net you $100 of credit to spend over 60 days, and if you stick with them I’ll get a small $25 credit to my own account. Win win!

My Referral link to sign up with DigitalOcean

Note: If you already have a Kubernetes cluster setup and configured, then you can skip the initial cluster and node pool provisioning step below and move on to the Helm setup part.

Deploy a Kubernetes node pool on DigitalOcean

You could simply do this with the Web UI console (which makes things really simple), but here I’ll be providing the doctl commands to do this via the command line.

First of all, if you don’t have it already download and setup the latest doctl release. Make sure it’s available in your PATH.

Initialise / authenticate doctl. Provide your own API key when prompted.

doctl auth init

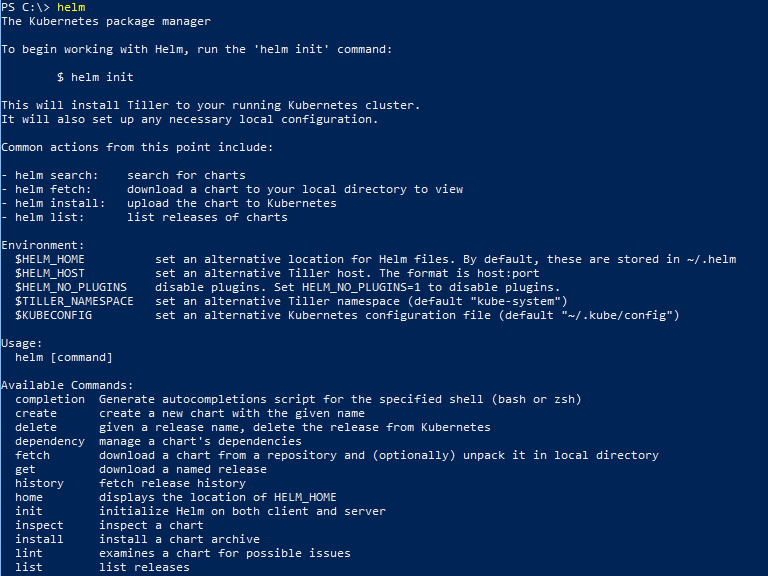
Right now, the help documentation in doctl version 1.12.2 does not display the kubernetes related commands arguments, but they’re available and do work.

Create a new Kubernetes cluster with just a single node of the smallest size (you can adjust this to your liking of course). I want a nice cheap cluster with a single node for now.

doctl k8s cluster create example-cluster --count=1 --size=s-1vcpu-2gb

The command above will provision a new cluster with a default node pool in the NYC region and wait for the process to finish before completing. It’ll also update your kubeconfig file if it detects one on your system.

output of the doctl k8s cluster create command

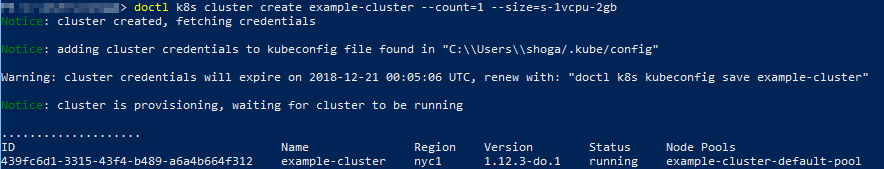
Once it completes, it’ll return and you’ll see the ID of your new cluster along with some other details output to the screen.

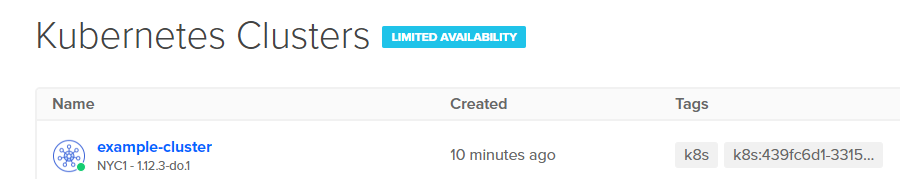
Viewing the Kubernetes console in your browser should also show it ready to go. You can download the config from the web console too if you wish.

Kubeconfig setup

If you’re new to configuring kubectl to manage Kubernetes, follow the guide here to use your kube config file that DigitalOcean provides you with.

the load balancer that will front your Ingress Controller on DigitalOcean Kubernetes

Handling different cluster contexts

With kubectl configured, test that it works. Make sure you’re in your new cluster’s context.

kubectl config use-context do-nyc1-example-cluster

If you’re on a Windows machine and use PowerShell and have multiple Kubernetes clusters, here is a simple set of functions I usually add to my PowerShell profile – one for each cluster context that allows easy switching of contexts without having to type out the full kubectl command each time:

Open your PowerShell profile with:

notepad $profile

Add the following (one for each context you want) – make sure you replace the context names with your own cluster names:

function kubecontext-minikube { kubectl config use-context minikube }
function kubecontext-seank8s { kubectl config use-context sean.k8s.local }
function kubecontext-digitalocean { kubectl config use-context do-nyc1-example-cluster }

Simply enter the function name and hit enter in your PS session to switch contexts.

If you didn’t have any prior clusters setup in your kubeconfig file, you should just have your new DigitalOcean cluster context selected already by default.

Deploy Helm to your cluster

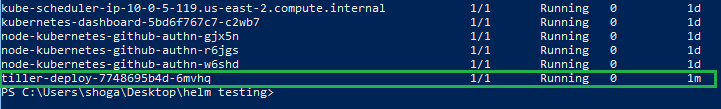
Time to setup Helm. Follow this guide to install and configure helm using kubectl.

helm logo

Deploy the Helm nginx-ingress chart to enable an Ingress Controller on DigitalOcean in your Kubernetes cluster

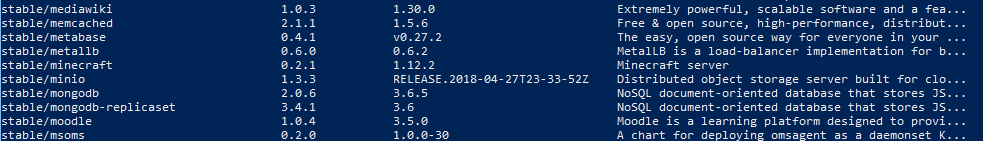
Now that you have helm setup, you can easily deploy an Ingress Controller to your cluster using the nginx helm chart (package).

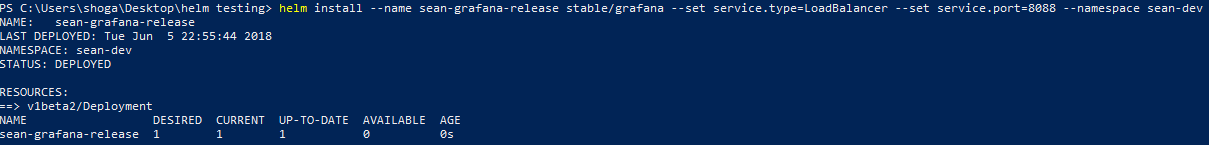
helm install --name nginx-ingress stable/nginx-ingress --set service.type=LoadBalancer --namespace default

When you specify the service.type of “LoadBalancer”, DigitalOcean will provision a LoadBalancer that fronts this Kubernetes service on your cluster. After a few moments the Helm deployment should complete (it’ll run async in the background).

You can monitor the progress of the service setup in your cluster with the following command:

kubectl --namespace default get services -o wide -w nginx-ingress-controller

Open the Web console, go to Networking, and then look for Load Balancers.

You should see your new NGINX load balancer. This will direct any traffic through to your worker pool node(s) and into the Kubernetes Service resource that fronts the pods running NGINX Ingress.

view of the digitalocean load balancer

At this point you should be able to hit the IP Address in your web browser and get the default nginx backend for ingress (with a 404 response). E.g.

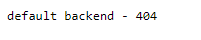
Great! This means it’s all working so far.

Create a couple of basic web deployments inside your cluster

Next up you’ll create a couple of very simple web server Deployments running in single pods in your cluster’s node pool.

Issue the following kubectl command to create two simple web deployments using Google’s official GCR hello-app image. You’ll end up with two deployments and two pods running separately hosted “hello-app” web apps.

kubectl run web-example1 --image=gcr.io/google-samples/hello-app:2.0 --port=8080
kubectl run web-example2 --image=gcr.io/google-samples/hello-app:2.0 --port=8080

Confirm they’re up and running wth 1 pod each:

kubectl get deployments
NAME                            DESIRED   CURRENT   UP-TO-DATE   AVAILABLE   AGE
web-example1                    1         1         1            1           12m
web-example2                    1         1         1            1           23m

Now you need a service to back the new deployment’s pods. Expose each deployment with a simple NodePort service on port 8080:

kubectl expose deployment/web-example1 --type="NodePort" --port 8080
kubectl expose deployment/web-example2 --type="NodePort" --port 8080

A NodePort service will effectively assign a port number from your cluster’s service node port range (default between 30000 and 32767) and each node in your cluster will proxy that specific port into your Service on the port you specify. Nodes are not available externally by default and so creating a NodePort service does not expose your service externally either.

Check the services are up and running and have node ports assigned:

kubectl get services
NAME                            TYPE           CLUSTER-IP       EXTERNAL-IP      PORT(S)                      AGE
web-example1                    NodePort       10.245.125.151   <none>           8080:30697/TCP               13m
web-example2                    NodePort       10.245.198.91    <none>           8080:31812/TCP               24m

DNS pointing to your Load Balancer

Next you’ll want to set up a DNS record to point to your NGINX Ingress Controller Load Balancer IP address. Grab the IP address from the new Kubernetes provisioned Load Balancer for Ingress from the DigitalOcean web console.

Create an A record to point to this IP address.

Create your Ingress Rules

With DNS setup, create a new YAML file called fanout.yaml:

This specification will create an Kubernetes Ingress Resource which your Ingress Controller will use to determine how to route incoming HTTP requests to your Ingress Controller Load Balancer.

apiVersion: extensions/v1beta1
kind: Ingress
metadata:
  name: simple-fanout-example
  annotations:
    nginx.ingress.kubernetes.io/rewrite-target: /
spec:
  rules:
  - host: example-ingress.yourfancydomainnamehere.com
    http:
      paths:
      - path: /*
        backend:
          serviceName: web-example1
          servicePort: 8080
      - path: /web2/*
        backend:
          serviceName: web-example2
          servicePort: 8080

Make sure you update the host value under the first rule to point to your new DNS record (that fronts your Ingress Controller Load Balancer). i.e. the “example-ingress.yourfancydomainnamehere.com” bit needs to change to your own host / A record you created that points to your own Load Balancer IP address.

The configuration above is a typical “fanout” ingress setup. It provides two rules for two different paths on the host DNS you setup and allows you to route HTTP traffic to different services based on the hostname/path.

This is super useful as you can front multiple different services with a single Load Balancer.

  • example-ingress.yourfancydomainnamehere.com/* -> points to your simple web deployment backed by the web-example1 service you exposed it on. Any request that does not match any other rule will be directed to this service (*).
  • example-ingress.yourfancydomainnamehere.com/web2/* -> points to your web-example2 service. If you hit your hostname with the path /web2/* the request will go to this service.

Testing

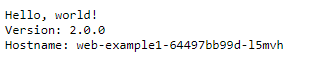
Try browse to the first hostname using your own DNS record and try different combinations that match the rules you defined in your ingress rule on HTTP. You should get the web-example1 “hello-app” being served from your web-example1 pod for any request that does not match /web2/*. E.g. /foo.

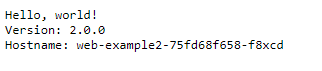
For /web2/* you should get the web-example2 “hello-app” default web page. It’ll also display the name of the pod it was served from (in my case web-example2-75fd68f658-f8xcd).

Conclusion

Congratulations! You now have a single Load Balancer fronting an NGINX Ingress Controller on DigitalOcean Kubernetes.

You can now expose multiple Kubernetes run services / deployments from a single Ingress and avoid the need to have multiple Load Balancers running (and costing you money!)

Editing a webapp or site’s HTTP headers with Lambda@Edge and CloudFront

dark clouds in the sky

Putting CloudFront in front of a static website that is hosted in an S3 bucket is an excellent way of serving up your content and ensuring it is geographically performant no matter where your users are by leveraging caching and CloudFront’s geographically placed edge locations. You can go one step further and customise your HTTP headers with Lambda@Edge and CloudFront.

The basic Cloudfront and S3 origin setup goes a little something like this:

  • Place your static site files in an S3 bucket that is set up for static web hosting
  • Create a CloudFront distribution that uses the S3 bucket content as the origin
  • Add a cache behaviour to the distribution

This is an excellent way of hosting a website or webapp that can be delivered anywhere in the world with ultra low latency, and you don’t even have to worry about running your own webserver to host the content. Your content simply sits in an S3 bucket and is delivered by CloudFront (and can be cached too).

Modifying HTTP headers with Lambda@Edge and CloudFront

But what happens if you want to get a little more technical and serve up custom responses for any HTTP requests for your website content? Traditionally you’d need a custom webserver that you could use to modify the HTTP request/response lifecycle (such as Varnish / Nginx).

That was the case until Lambda@Edge was announced.

I was inspired to play around with Lambda@Edge after reading Julia Evan’s blog post about Cloudflare Workers, where she set up something similar to add a missing Content-Type header to responses from her blog’s underlying web host. I wanted to see how easy it was to handle in an AWS setup with S3 hosted content and CloudFront.

So here is a quick guide on how to modify your site / webapp’s HTTP responses when you have CloudFront sitting in front of it.

Note: you can run Lambda@Edge functions on all these CloudFront events (not just the one mentioned above):

  • After CloudFront receives a request from a viewer (viewer request)
  • Before CloudFront forwards the request to the origin (origin request)
  • After CloudFront receives the response from the origin (origin response)
  • Before CloudFront forwards the response to the viewer (viewer response)
  • You can return a custom response from Lambda@Edge without even sending a request to the CloudFront origin at all.

Of course the only ones that are guaranteed to always run are the Viewer type events. This is because origin request and origin response events only happen when the requested object is not already cached in an edge location. In this case CloudFront forwards a request to the origin and will receive a response back from the origin (hopefully!), and these events you can indeed act upon.

How to edit HTTP responses with Lambda@Edge

Create a new Lambda function and make sure it is placed in the us-east-1 region. (There is a requirement here by AWS that the function must be created in the US East / N. Virginia Region). When you create the function, it is deployed to all regions across the world with their own replication version of the Lambda@Edge function.

Fun fact: your CloudWatch logs for Lambda@Edge will appear in the relevant region where your content is requested from – i.e. based on the region the edge location exists in that ends up serving up your content.

You’ll need to create a new IAM Role for the function to leverage, so use the Lambda@Edge role template.

Select Node 6.10 runtime for the function. In the code editor, setup the following Node.js handler function which will do the actual header manipulation work:

exports.handler = (event, context, callback) => {
    const response = event.Records[0].cf.response;
    const headers = response.headers;
    
    headers['x-sean-example'] = [{key: 'X-Sean-Example', value: 'Lambda @ Edge was here!'}];
    
    callback(null, response);
};

basic lambda function configuration

The function will receive an event for every request passing through. In that event you simply retrieve the CloudFront response event.Records[0].cf.response and set your required header(s) by referencing the key by header name and setting the value.

Make sure you publish a version of the Lambda function, as you’ll need to attach it to your CloudFront behavior by ARN that includes the version number. (You can’t use $LATEST, so make sure you use a numerical version number that you have published).

Now if you make a new request to your content, you should see the new header being added by Lambda@Edge!

HTTP header view showing modified header and value.

Lambda@Edge is a great way to easily modify CloudFront Distribution related events in the HTTP lifecycle. You can keep response times super low as the Lambda functions are executed at the edge location closest to your users. It also helps you to keep your infrastructure as simple as possible by avoiding the use of complicated / custom web servers that would otherwise just add unecessary operational overhead.

Setting up Helm for Kubernetes (with RBAC) and Deploying Your First Chart

I was pointed to Helm the other day and decided to have a quick look at it. I tasked myself with setting it up in a sandbox environment and deploying a pre-packaged application (a.k.a chart, or helm package) into my Kubernetes sandbox environment.

Helm 101

The best way to think about Helm is as a ‘package manager for Kubernetes’. You install Helm as a cli tool (It’s written in Golang) and all the operations it provides to you, you’ll find are very similar to those of common package managers like npm etc…

Helm has a few main concepts.

  • As mentioned above, a ‘Chart’ is a package for Helm. It contains the resource definitions required to run an app/tool/service on a Kubernetes cluster.
  • A ‘Repository’ is where charts are stored and shared from
  • A ‘Release’ is an instance of a chart running in your Kubernetes cluster. You can create multiple releases for multiple instances of your app/tool/service.

More info about Helm and it’s concepts can be found on the Helm Quickstart guide. If however, you wish to get stuck right in, read on…

This is a quick run-down of the tasks involved in setting it up and deploying a chart (I tried out kube-slack to provide slack notifications for failed kubernetes operations in my sandbox environment to my slack channel).

Setting up Helm

Download and unzip the latest Helm binary for your OS. I’m using Windows so I grabbed that binary, unblocked it, and put in a folder found in my path. Running a PowerShell session I can simply type:

helm

Helm executes and provides a list of possible options.

Before you continue with initialising Helm, you should create a service account in your cluster that Helm will use to manage releases across namespaces (or in a particular namespace you wish it to operate in). For testing its easiest to set up the service account to use the default built-in “cluster-admin” role. (To be more secure you should set up Tiller to have restricted permissions and even restrict it based on namespace too).

To setup the basic SA with the cluster-admin role, you’ll need a ClusterRoleBinding to go with the SA. Here is the config you need to set both up.

apiVersion: v1
kind: ServiceAccount
metadata:
  name: tillersa
  namespace: kube-system
---
apiVersion: rbac.authorization.k8s.io/v1beta1
kind: ClusterRoleBinding
metadata:
  name: tillersa-clusterrolebinding
roleRef:
  apiGroup: rbac.authorization.k8s.io
  kind: ClusterRole
  name: cluster-admin
subjects:
  - kind: ServiceAccount
    name: tillersa
    namespace: kube-system

Run kubectl create and point to this config to set up the SA and ClusterRoleBinding:

kubectl create -f .\tillersa-and-cluster-rolebinding.yaml

Now you can do a helm initialisation.

helm init --service-account tillersa --tiller-namespace kube-system

If all went well, you’ll get a message stating it was initialised and setup in your cluster.

Run:

kubectl get pods -n=kube-system

and you should see your new tiller-deploy pod running.

Deploying Charts with Helm

Run helm list to see that you currently have no chart releases deployed.

helm list

You can search the public Helm repository for charts (applications/tools/etc) that you can now easily deploy into your cluster.

helm search

Search for ‘grafana’ with helm. We’ll deploy that to the cluster in this example.

helm search grafana

Next up you might want to inspect and discover more about the chart you’re going to install. This is useful to see what sort of configuration parameters you can pass to it to customise it to your requirements.

helm inspect grafana

Choose a namespace in your cluster to deploy to and a service type for Grafana (to customise it slightly to your liking) and then run the following, replacing the service.type and service.port values for your own. For example you could use a ClusterIP service instead of LoadBalancer like I did:

helm install --name sean-grafana-release stable/grafana --set service.type=LoadBalancer --set service.port=8088 --namespace sean-dev

Helm will report back on the deployment it started for your release.

The command is not synchronous so you can run helm status to report on the status of a release.

helm status sean-grafana-release

Check on deployments in your namespace with kubectl or the Kubernetes dashboard and you should find Grafana running happily along.

In my case I used a LoadBalancer service, so my cluster being AWS based spun up an ELB to front Grafana. Checking the ELB endpoint on port 8088 as I specified in my Helm install command sure enough shows my new Grafana app’s login page.

The chart ensures all the necessary components are setup and created in your cluster to run Grafana. Things like the deployment, the service, service account, secrets, etc..

In this case the chart outputs instructions on how to retrieve your Grafana admin password for login. You can see how to get that in the output of your release.

Tidy Up

To clean up and delete your release simply do:

helm delete sean-grafana-release

Concluding

Done!

There is plenty more to explore with helm. If you wish to change your helm configuration with helm init, look into using the –upgrade parameter. helm reset can be used to remove Helm from your cluster and there are many many more options and scenarios that could be covered.

Explore further with the helm command to see available commands and do some digging.

Next up for me I’ll be looking at converting one of my personal applications into a chart that I can deploy into Kubernetes.